Bitcoin is digital Gold
A case for $73,000 per coin being cheap

This is my first monthly, and with that, please set your expectations low.
January presented a challenging start to the year as BTC slid roughly 20% as equities continued to rise, and comparative store of value assets Gold & Silver continued their meteoric rise.
Bitcoin is at a critical juncture between the cryptographically scarce, anti-fragile store of value that it is, and the risky tech bet that it’s perceived as; never has this contrast been as stark as it is today.
Amidst rising fears on dollar’s reserve status, broadly positive liquidity conditions, and a pro-admin, it would seem Bitcoin has the framework to establish itself on a global stage with the institutional access to match in ETFs, DATs & more.
In my view, Bitcoin weakness here is more technical than fundamental. In 2 years Bitcoin rallied 700%, before returning flat in the third year. This ‘lacklustre’ performance is a necessary condition to increase the cost basis of holders, and allow for increasing distribution from the wallets of old to a new institutionally focused holder base.
On this view, the narratives ascribed to downperformance from Quantum fears, to Trump fatigue are all over-stated and hindsight driven narratives ascribed as a consequence of price rather than fundamentals. Whilst I build out tooling & data pipelines; future updates will discuss broader macro & crypto-specific areas I’m excited about in more depth; this month I want to focus on BTC.
Pricing in Gold
Since the dawn of time, assets have been continually priced by their purchasing power in Gold. Gold has, and is the de-facto store of value currency of our species; until there becomes an era of gold abundance.
I need not bore you with why Gold is a measure of real-purchasing power; only to note that pricing assets in Gold is helpful to understand their relative purchasing power, and how those relationships have changed.
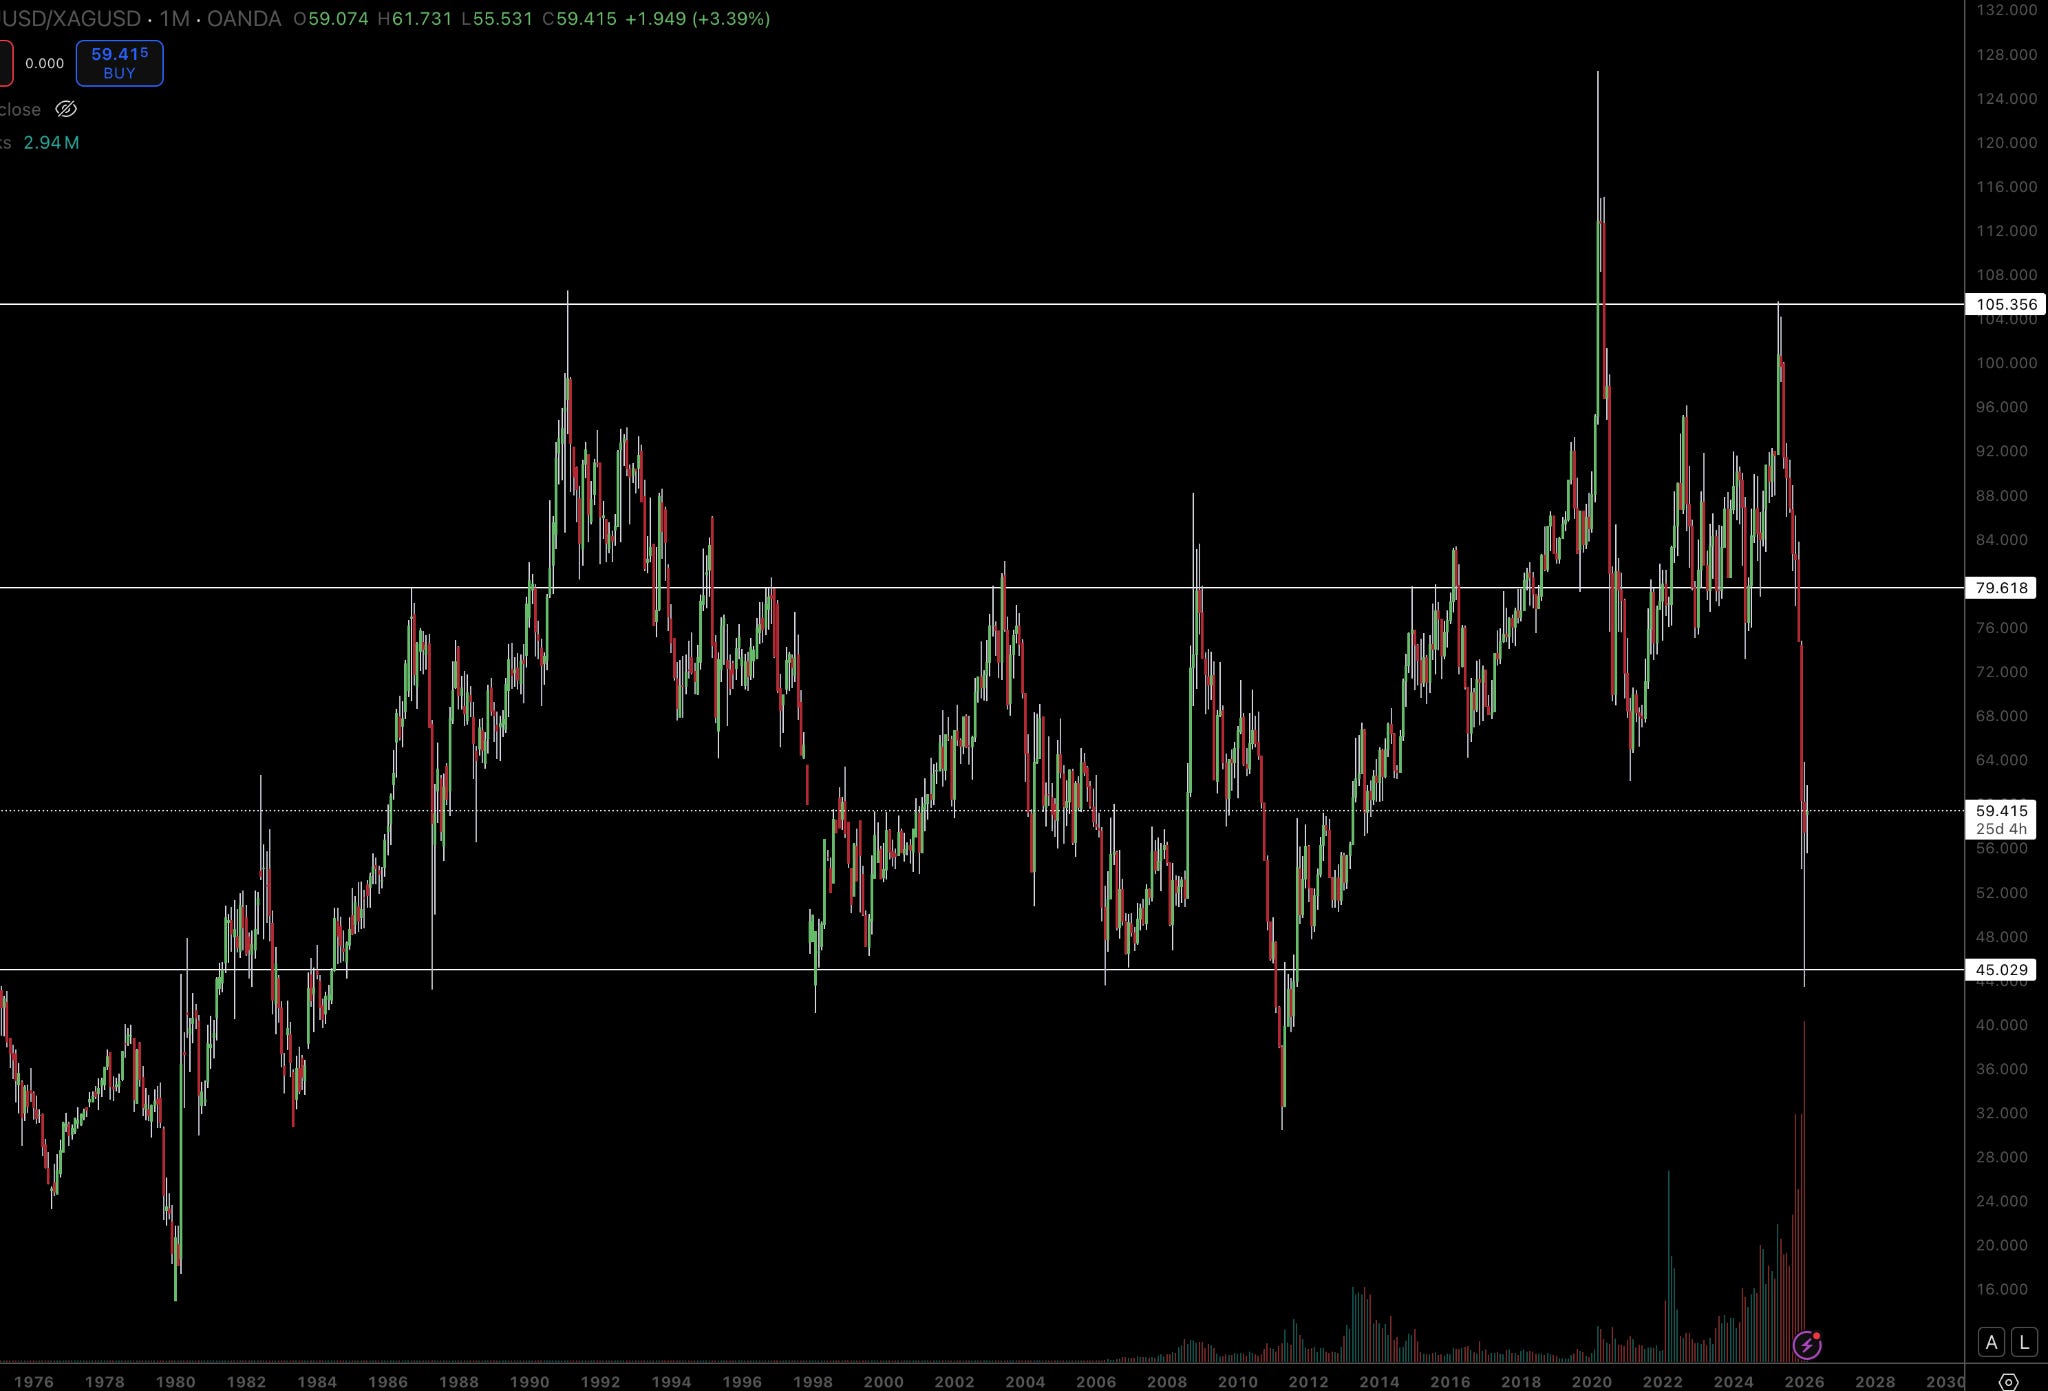
The figure below shows the relative value between Gold & Silver since 1976, which has maintained a very specific range between 45 & 105. The relative value of Silver, then can be comparatively priced through time in Gold, to determine whether or if it’s historically cheap or rich. Silver’s most recent rise to $120 was primarily driven by speculation into metals, driving this ratio to 45. The only previous times it has traded at these levels was post GFC in 2011 & after the LTCM crisis in 1988. Nothing fundamental has changed in this relationship to warrant this pricing, therefore it’s highly likely this was a mispricing, which shortly got corrected to closer to 60.
This is relevant for two reasons;
There is a high degree of speculation in the markets. Gold gained 3-4 Bitcoin market caps in a single day. Silver gained Bitcoins market cap in just a few days. There is enough liquidity, and demand for store of value assets.
Silver priced in it’s purchasing ability to Gold is a good metric for determining whether it is cheap or rich in ‘Gold’ terms. ,
The figure below shows the relative price of Bitcoin when compared to Gold.
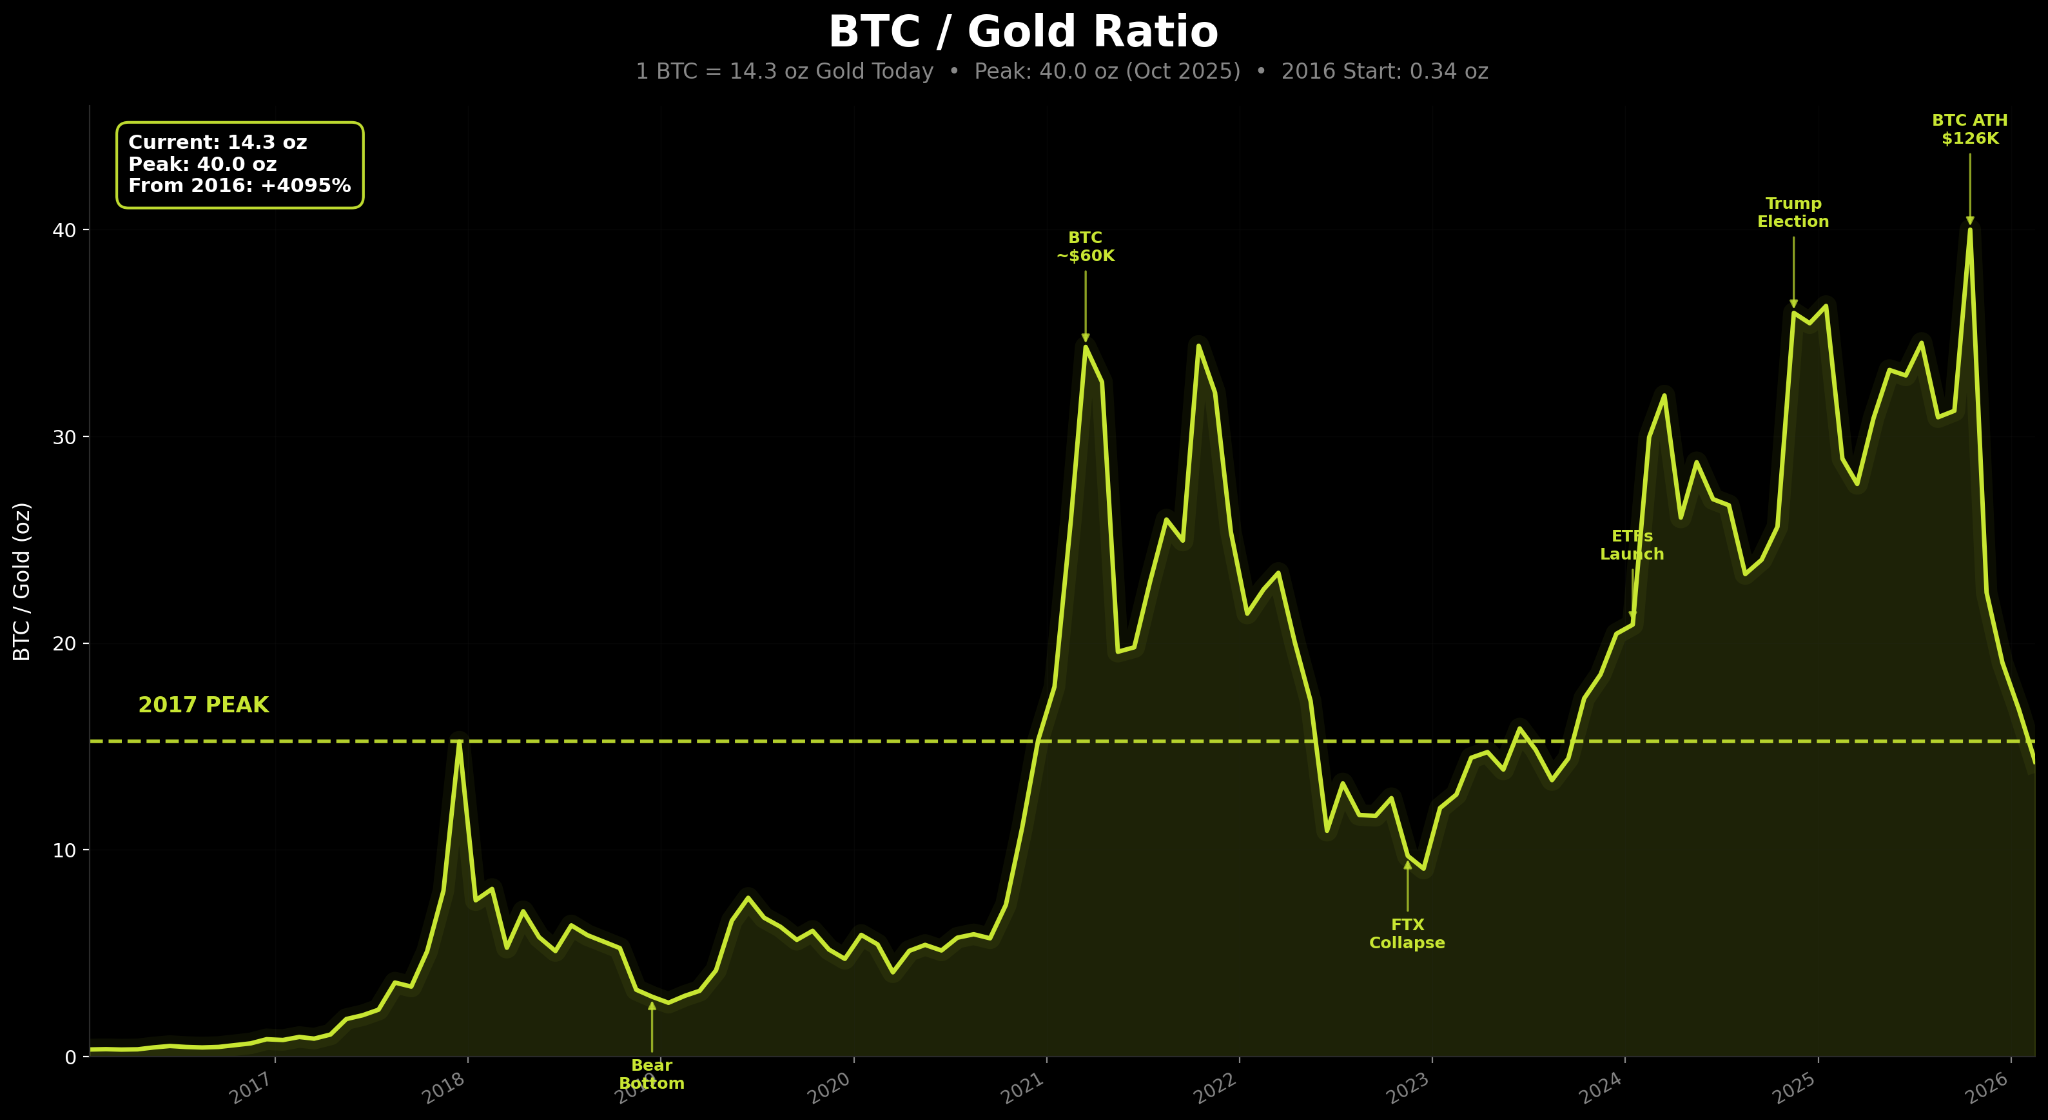
Given Gold’s continued performance, and Bitcoin’s relative weakness, this ratio has reached 2017 levels. In my view, this is mis-priced. My long-term view being Bitcoin is a superior digitally scarce, anti-fragile store of value when compared to Gold; an asset 23x larger than BTC.
But particularly, this ratio suggests that the ratio between BTC & Gold should stand at the same levels of 2017 highs, and close to 2022 lows. Since those two points, we’ve had meaningful levels of adoption across the world, from ETFs, to entire countries in El Salvador, to pro-governmental support, strategic reserves, positive legislation, worldwide acceptance.
Quite frankly, we are worlds away from either the 2022 lows, or the 2017 highs where this ratio is priced, and the price implies. Whilst Gold underperformance could drive this ratio, it is BTC outperformance that I make the case for.
Why the market has structurally changed
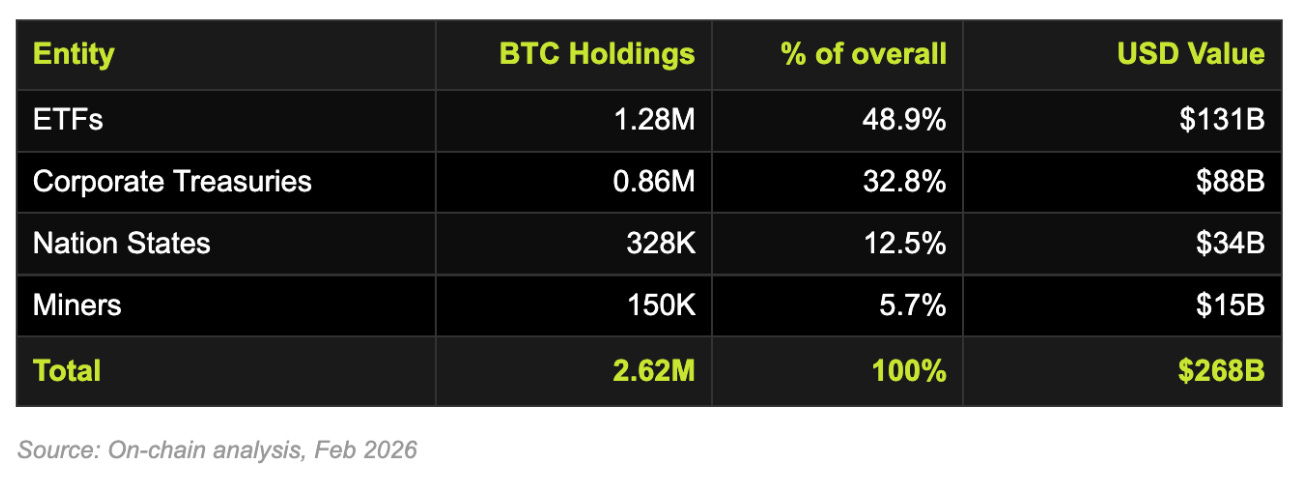
For those well-accustomed to BTC bear markets, a 40% decline doesn’t really begin to touch the sides. The previous bear market touched a 79% decline whilst others touched 85%. However, in my view, the marginal purchaser of Bitcoin is no longer retail based traders on Binance, it’s sovereign wealth funds, pension funds, endowment funds, nation states. Fig.3 shows the increase of price insensitive token sinks, which have risen from representing less than 1% of BTCs supply to over 13%.
An estimated 17% of supply is also lost, locked or otherwise inaccessible. Around 30% of BTCs supply is either lost, or held by price insensitive holders. This is likely the most amount of BTC held in sticky hands in Bitcoin’s 17 year tenure; the catalysts for a supply driven shock, as we’ve witnessed with other commodity-esque assets can be very real. Below is a table of how I’ve calculate ‘token sinks’, across different categories. Of course, ETFs are not token sinks, but they are price insensitive buyers. Since spot ETFs launched in the US they have acquired a significant number of BTC which hasn’t materially declined, and only continues to grow. In my view, they make up part of broader portfolios and are generally price insensitive buyers.
Cost of production model
I’ve modelled BTC’s cost of production, based on the cost of producing 1 BTC (Network energy consumption & Electricity price ) / BTC Miner per day. The cost of production is historically a good anchor price for commodities, and indeed for BTC. The current upper band cost of production is around $70,500; 5% away from BTCs monthly low in February. Approaching this zone has previously been an area of value territory for BTC; with this time being no different.
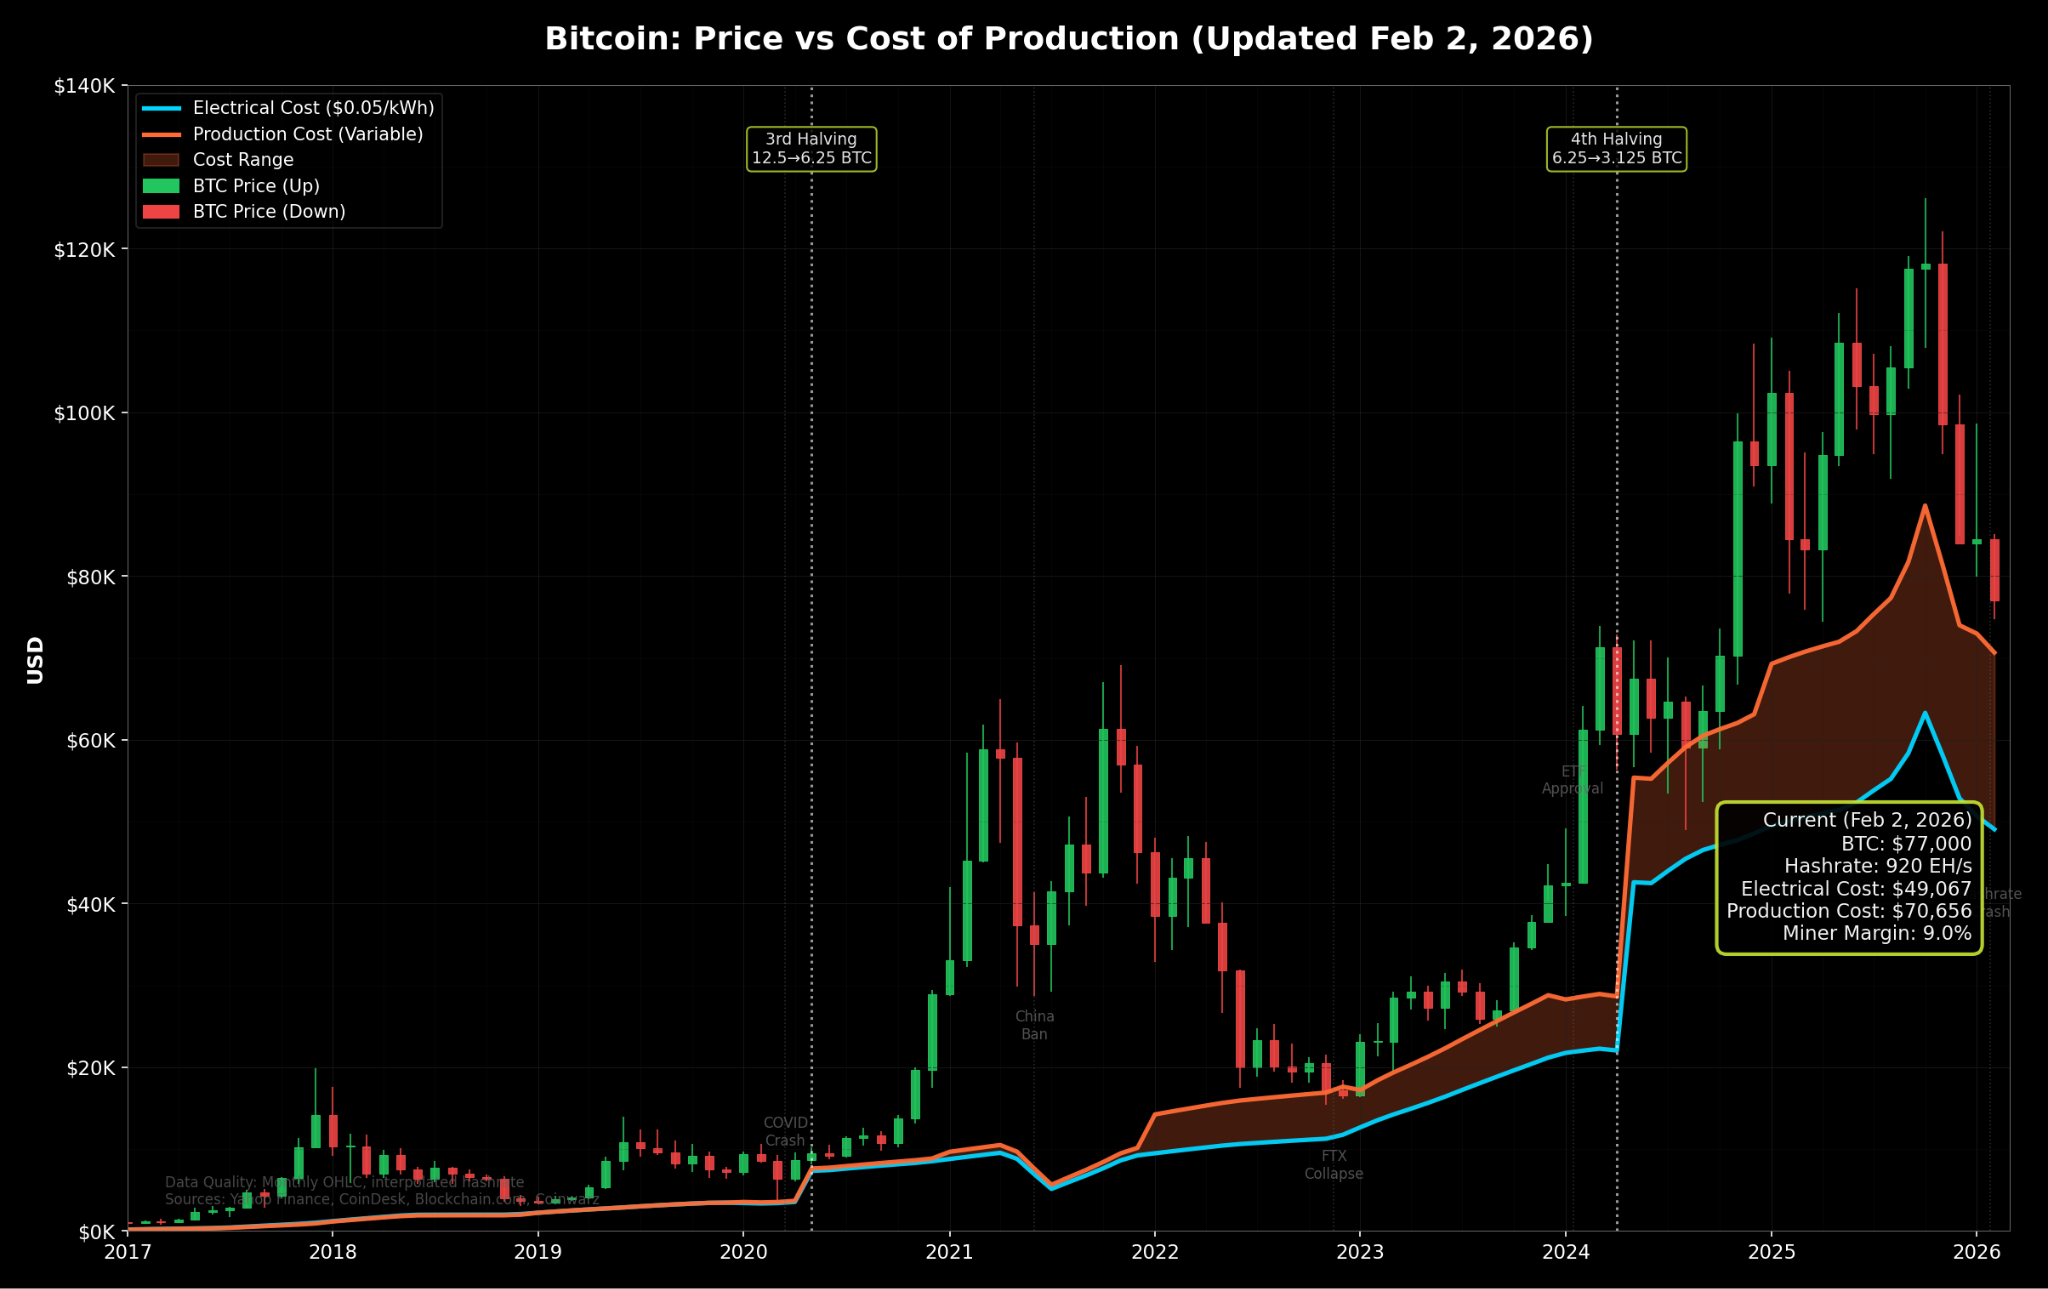
BTC has rarely traded below the cost of production, largely because smaller miners are forced to capitulate as price approaches the cost of production. Because inefficient miners can’t cover their costs, they shut down, resulting in more efficient miners remaining and fewer miners being forced to sell.
Positive technical indicators
Monday marked one of the largest drops over a weekend BTC has had over recent years, trading from $84k on Friday’s close to as low as $74k the following monday. Given it’s largely crypto native volume that drove that pricing, I would suggest that this is not wholly indicative of broader demand. Of course, for this thesis to play out, would require prices to return higher.
Part of this drive lower was a public liquidation of a $500mm position in ETH from a well-publicised trader on HL. One of the key drawbacks of public ledgers, and orderbooks, is the ability to derive transparent positioning across the entire market; this is why I strongly believe & advocate for a privacy focused DEX capable of maintaining the privacy & integrity of users.
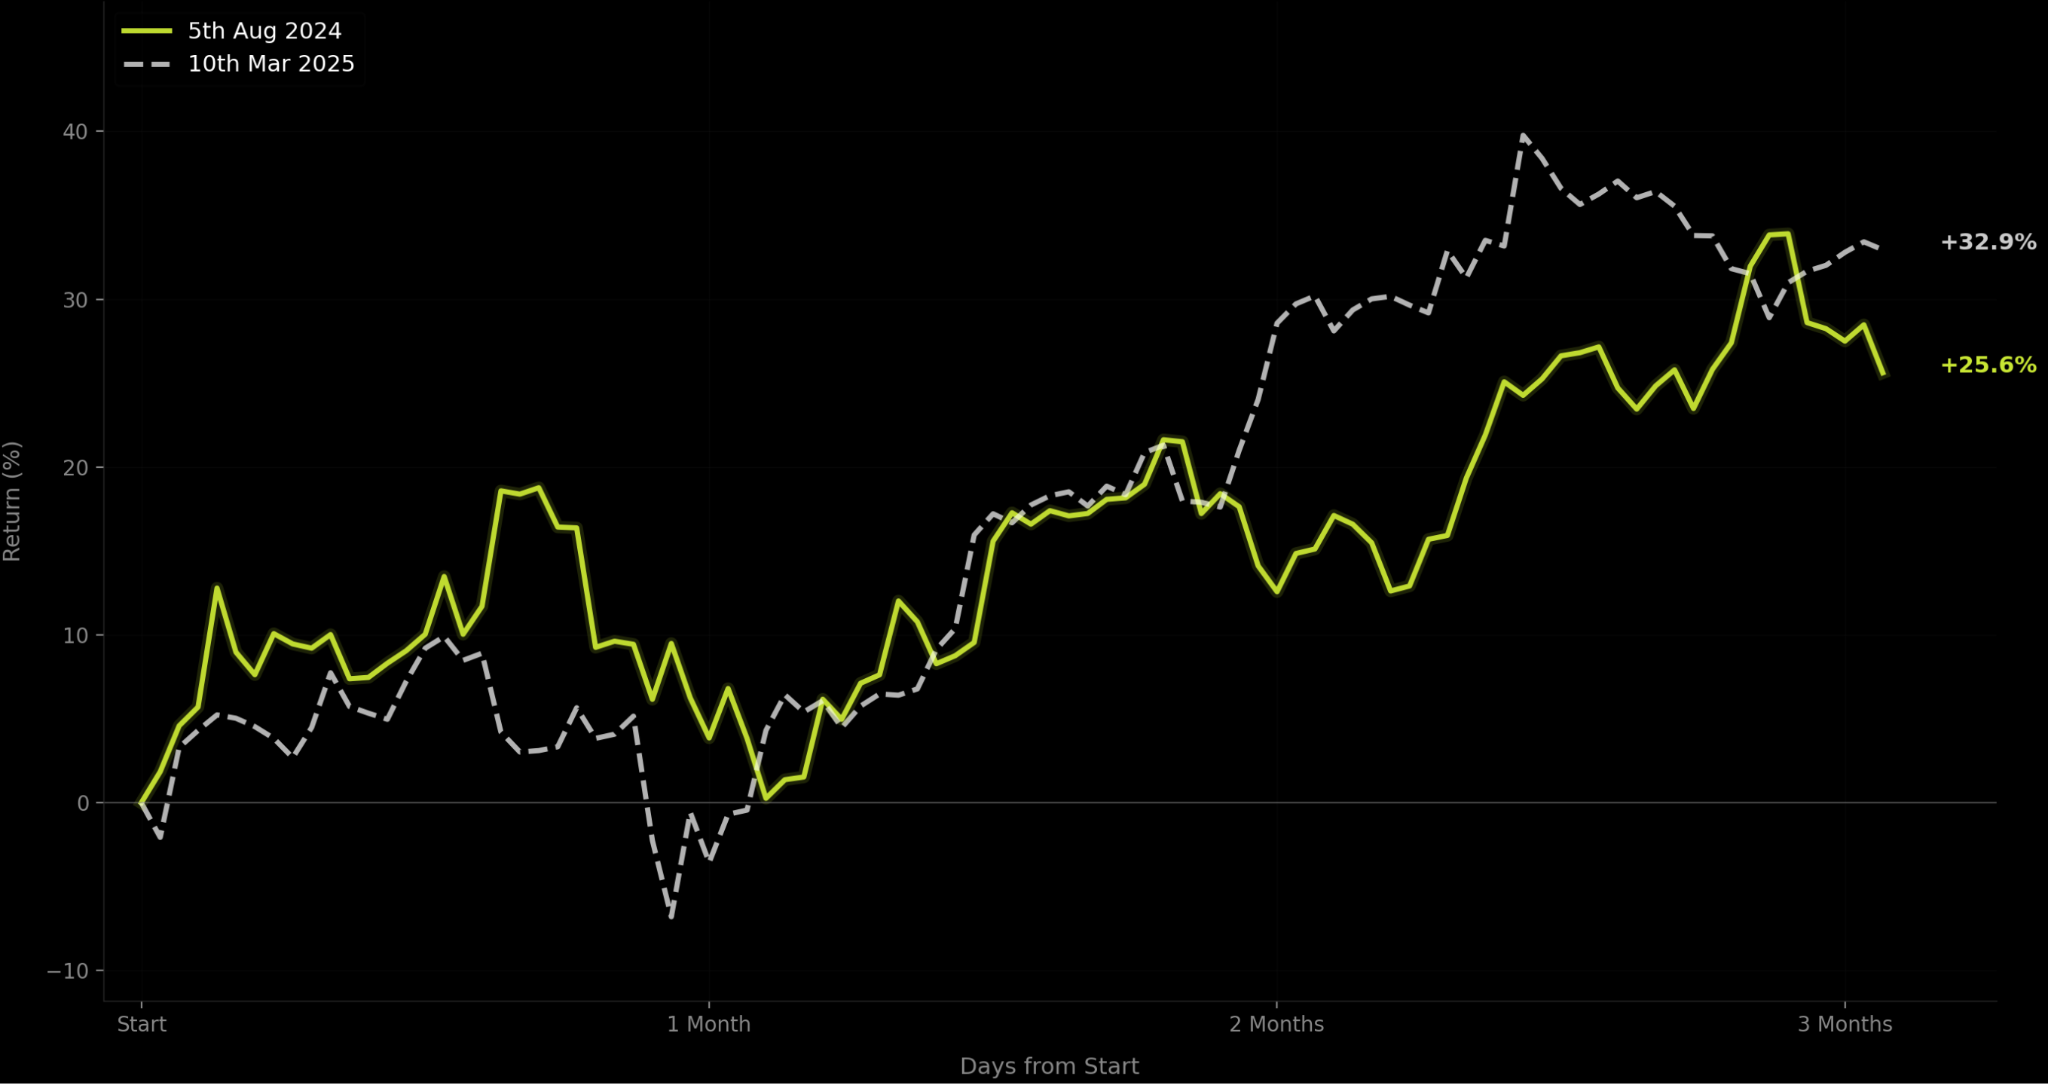
The figure above, shows the last times IBIT (Blackrock’s ETF) opened with a gap to the downside of > 6%. Over both cases (Aug 24, Mar 25) I normalised price with the opening day as first anchor point of return; the chart shows the following 3 months of price action. In both cases, weekend capitulation marked a significant bottom, and led to a 30% return over the following 3 months. If future is to rhyme with the past, this would put BTC in a range from $95-105k.
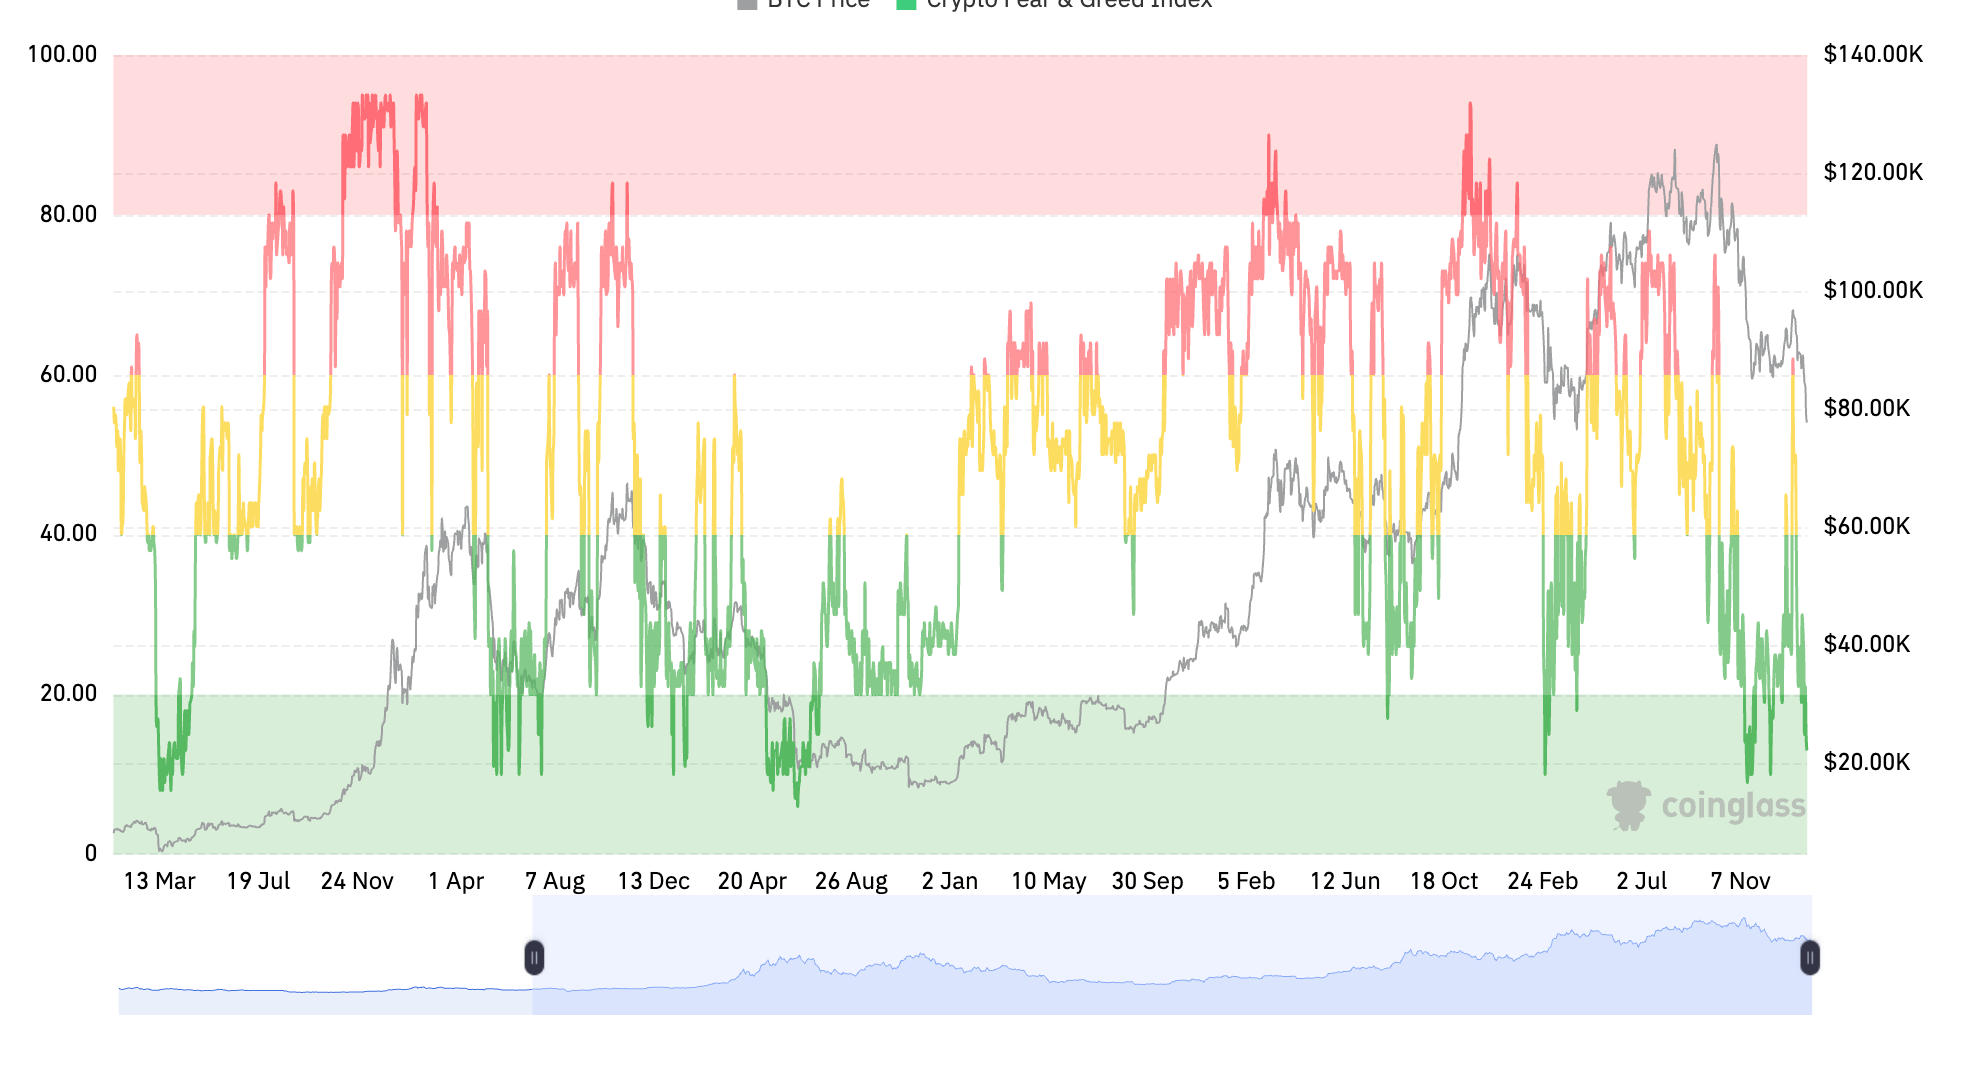
BTCs fear and greed index has also rarely been this low for this length of time. Previous examples that are notable are August 2021 ($30k -> $69k), July 2022 ($20k), and Feb/March 2025 ($75k -> $120k). The sustained fear, and negative sentiment also sets a more clear foundation for positive price appreciation to arise, rather than the euphoric froth that dominates the end of a trend.
Altcoin related markets have continued to struggle amidst worsening liquidity within crypto markets since the October 10th margin wipe. Stablecoin market caps have been declining, but perhaps most significantly, very few altcoins have had any meaningful positive performance outside of Hyperliquid. The figure below is taken from Delphi research’s dashboard, of which only 6% of their altcoins they cover are positive over the past 12 months. A trend, which I suspect will continue as utility grounds itself in a market where speculation has dominated.
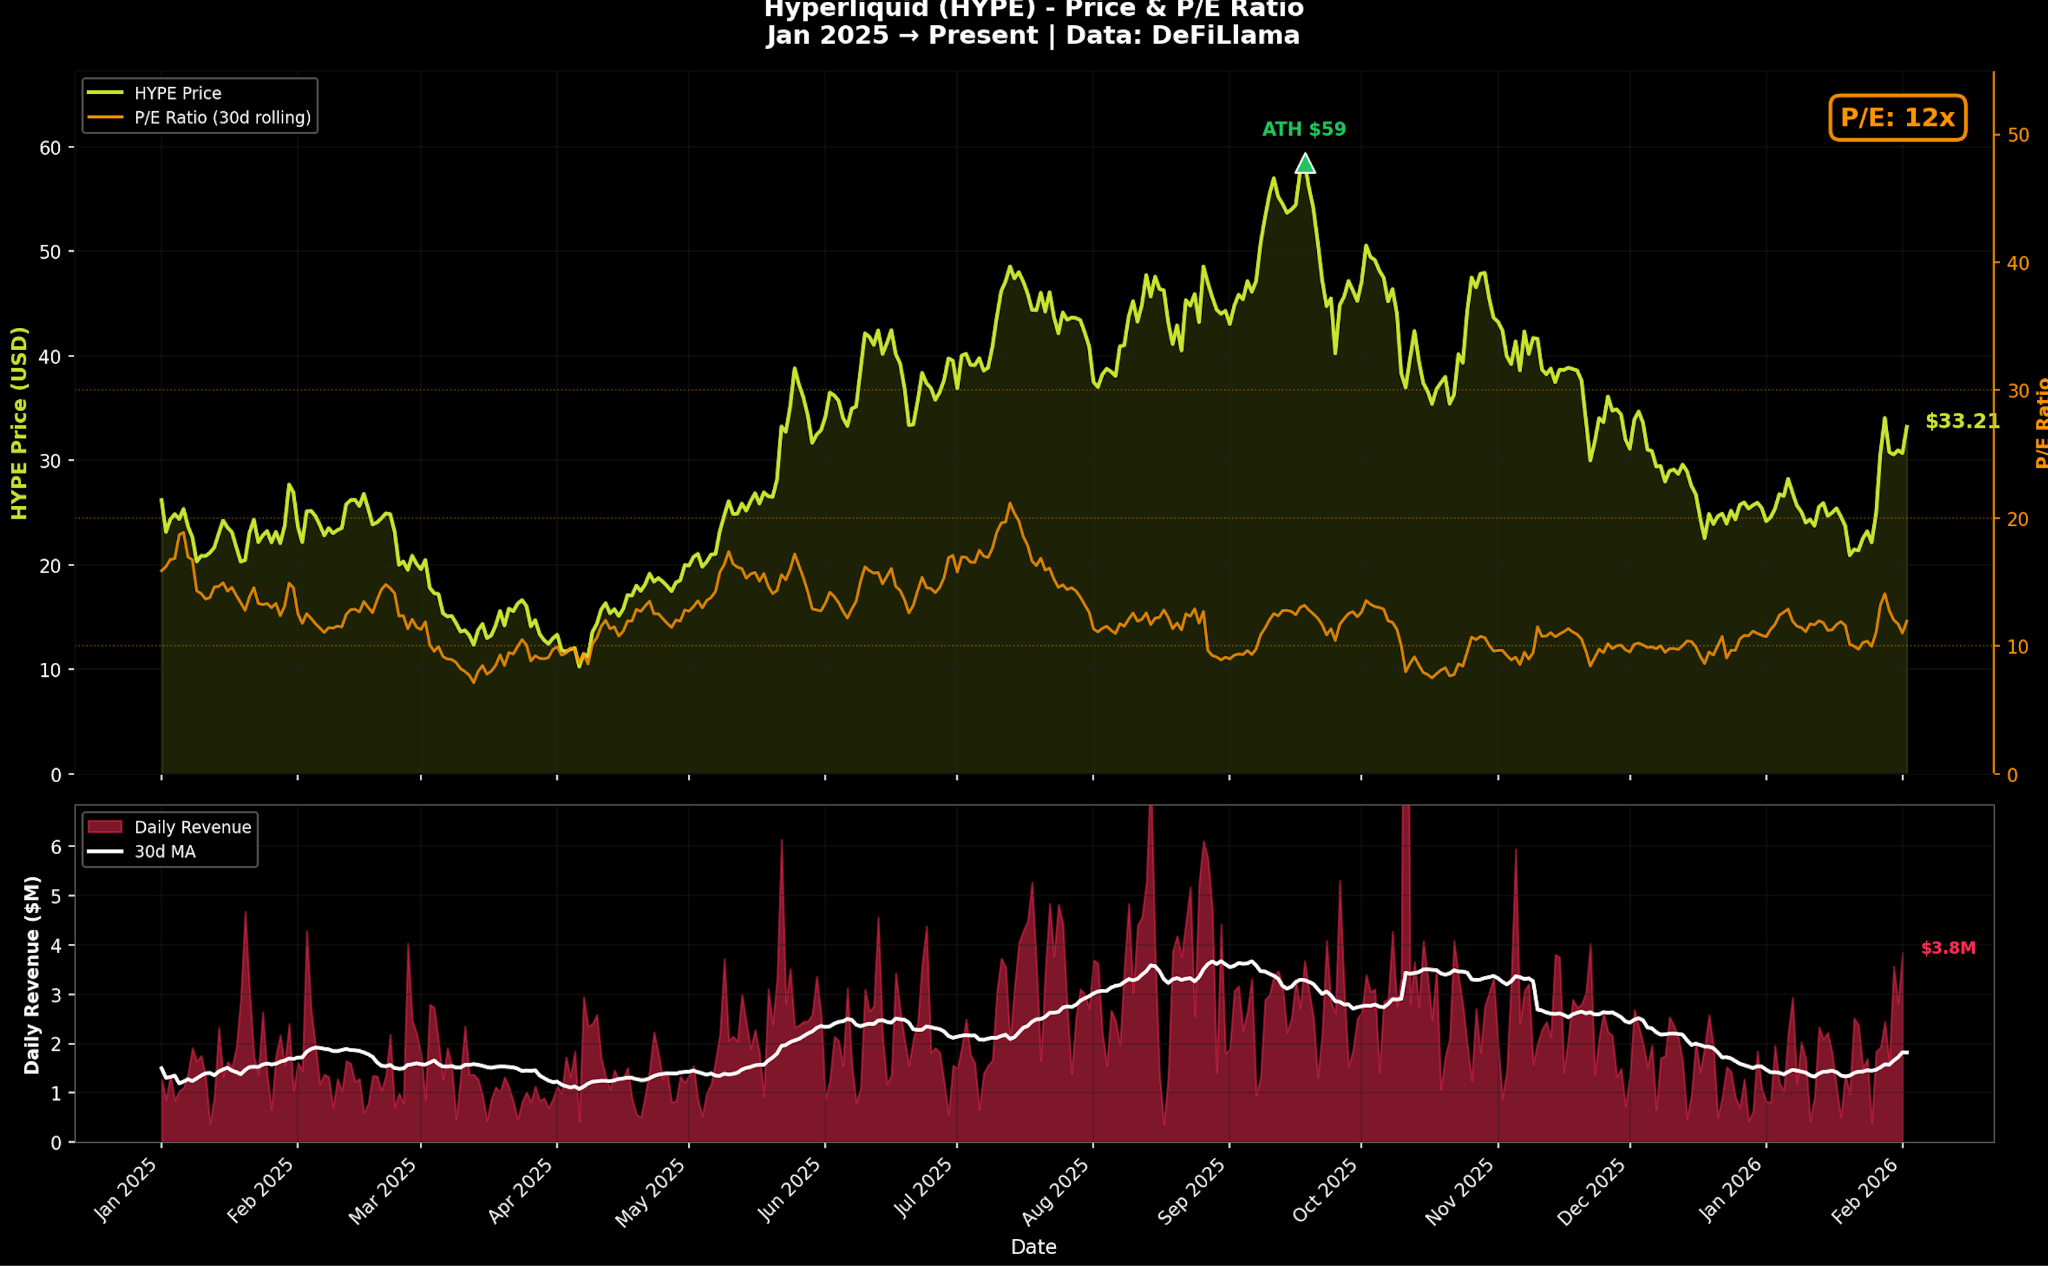
Finally a little note on Hyperliquid. Hyperliquid continues to be the only positive EV trade in the crypto industry. Rolling PE at 10-11x suggest it’s priced cheaply in comparison to it’s traditional peers in RH (30-40x) & Coinbase (30x). However, to note, it’s now trading at prices close to October 2024, when crypto liquidity and sentiment was much stronger than it is today. I expect HL to continue to gain market share on both ETH & SOL, but in the mid term I am cautious crypto-native liquidity is enough to sustain a meaningful rally past $30. There are several positive developments for HL from Hip-3 to prediction markets as it continues to print $880mm/yr in fees. However, there are also several headwinds ranging from the incentive of increased competition, to crypto volumes dwindling, and the possibile future effect of regulation. All of which are to be covered in future updates along with other crypto & macro specific topics.